FlowFarm Concept Model

Semi-flow-through RAS concept design helper for rainbow trout
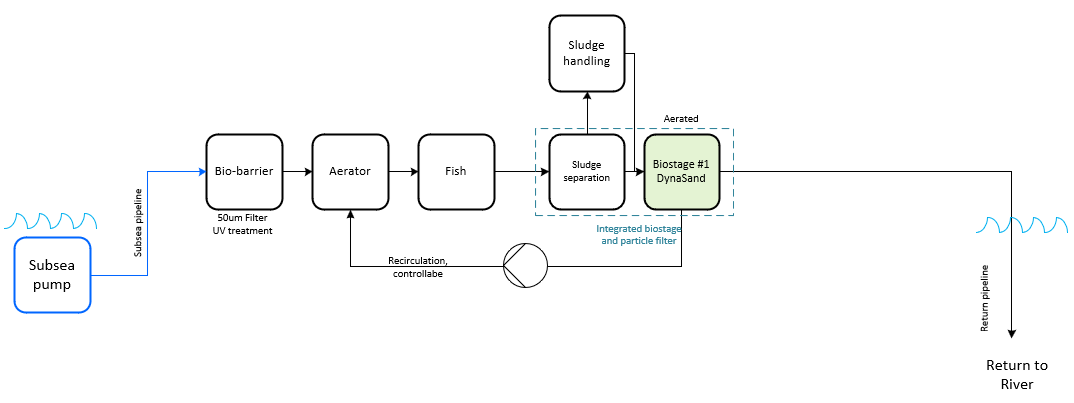
FlowFarm schematic – semi-flow-through RAS concept layout
FlowFarm schematic v1.0 – concept layout (semi-flow-through RAS)
Default case: 20 g fingerlings to 1.5 kg harvest weight in 365 days; about 30 t/year with 4 tanks (adjustable below).
Simplified early-stage model for quick sizing and concept comparison based on DABCE’s FlowFarm concept.
Growth / culture background: FAO cultured species – O. mykiss · FAO small-scale rainbow trout (PDF) · The Fish Site – rainbow trout
Input Parameters Inputs
Production
kg/year
tanks
g
g
days
Default concept: ~20 g → 1.5 kg in ~365 days (constant daily % growth in the engine). Real SGR falls with size and temperature — see Growth references below.
Growth

Growth period and implied daily rate are concept inputs, not a temperature-resolved growth model. Published ranges for rainbow trout (Oncorhynchus mykiss):

  • Pan-sized ~280–400 g typically after 12–18 months; food-market size sometimes ~9 months (FAO cultured species fact sheet – O. mykiss).
  • Larger fish (e.g. ~1–2 kg Europe; 3–5 kg marine cages) need longer cycles; ~70 g fry can reach ~3 kg in <18 months in favourable cage conditions (same FAO fact sheet).
  • Freshwater grow-out often ~30–40 cm market size within ~9 months under good temperature and feed (FAO fact sheet; see also FAO small-scale rainbow trout farming).
  • Industry overview / culture notes: The Fish Site – cultured rainbow trout.
  • Fingerling SGR in short trials can be ~2.5–3 %/day (size- and temp-dependent); average SGR over a full fingerling→portion cycle is much lower (e.g. Başçınar 2001, feeding-frequency study on fingerlings — UH Manoa / ISGA abstract).

Model default (~20 g → 1.5 kg / 365 d) implies roughly ~1.2 %/day constant weight growth — use as RFQ framing; replace with site temperature, strain and feed curves for design.

kg feed/kg fish
kg/m³
%
Of stocked fish (mortality + culls) over one cycle. Default 5 % for ~20 g fingerlings; ~10 g start often needs higher (≈ 8–12 %). Increases fingerlings purchased vs harvest count.
Water & Oxygen

Degassers maximise air-side O2 uptake (baseline ≈ 2.0 mg/L). Pure oxygen is additive on top of air — it raises total ΔDO so tank flow falls. Purchased O2 gas is only the pure-O2 share of demand, not a full replacement of aeration.

mg/L
Default 2 mg/L via cascade / packed degasser. Pure O2 addition = max(0, total strategy − this baseline). Recalculate after changing.

Hydraulic Layout
mm
Operating water depth in tanks.
mm
Water source level relative to tank bottom. Positive values indicate source water below tanks.
mm
Elevation of degasser inlet above tank water level.
Treatment
%
Drum filter / microscreen / settler on particulate waste (full solids stream).

DynaSand® oxy (effluent only)
Biological filter on discharge flow only — not on full recirculation. Dissolved C, N and P bound as biomass; limiting nutrient caps uptake. Current effluent design flow: 342.5 m³/h (≈ 8 219 m³/day).
%
How completely the C:N:P-limited substrate is converted in the filter.
%
Fine residual solids removal on the effluent path after primary separation.
Typical activated-sludge biomass: 100 : 5 : 1 (COD : N : P basis).

Chemical P-binder (optional)
Precipitates remaining dissolved P to sludge (Fe/Al salt concept). Does not remove N or COD.
%
kg / kg P
SEK/kg
% TS
Used for wet sludge mass and land-application figures.
Feed & Nutrients Tot-N / Tot-P / COD in feed → retention in fish → waste form (particulate vs dissolved)
Feed composition (as fed)
g/kg feed
≈ crude protein (%) ÷ 6.25 × 10. Default 64 g/kg (~40 % CP).
g/kg feed
Typical trout grower ~8–12 g P/kg.
g COD/kg feed
Concept organic load basis used with retention to set waste COD.
Retention in fish biomass
% of ingested N
% of ingested P
% of ingested COD
Excreted waste = feed load × (1 − retention). Defaults ≈ 40 g N, 4.4 g P, 279 g COD waste per kg feed.
Waste form from fish

Of excreted waste only — share as particulate solids; remainder dissolved (TAN, soluble P, dissolved COD).

% of waste N
Rest dissolved. Typical trout: mostly dissolved N.
% of waste P
Rest dissolved. Typical: most P in faeces.
% of waste COD
Fractions after Dalsgaard & Pedersen (2011) style trout balances.
Implied waste coefficients (from current inputs): Tot-N waste 40.0 g/kg feed · Tot-P waste 4.40 g/kg feed · COD waste 279 g/kg feed · (particulate N 12.5 %, P 97.3 %, COD 71.0 %)
Discharge limit targets Compare model effluent vs permit-style targets (set 0 to disable a criterion)
Concentration limits (mg/L)
mg/L
µg/L
mg/L
Defaults are concept placeholders (Tot-N 10 mg/L · Tot-P 500 µg/L · COD 70 mg/L) — replace with local permit values.
Annual load limits (kg/year)
kg/y
kg/y
kg/y
Leave at 0 if the permit uses concentration only (or set both if required).
CAPEX - Components and Project Execution
SEK
Suggested from flow & head: SEK = 5 000 + 40 × Q + 2 000 × H (Q in m³/h, H in m; rounded to 1 000 SEK) → 24 000 SEK.
Current: Q = 342.5 m³/h, H = 2.50 m (≈ 3.59 kW). Editable; leave at suggestion (or hard-refresh) to keep auto.
SEK
Aquaculture barrier (not DW sterilisation). Sized at target log 2.0 with shop duty flow Qsize ≈ 171.2 m³/h (Qhyd ≈ 342.5 × log/logref). CAPEX = shop excl. VAT × quote factor 0.50 (quoted prices, similar project 2026): dbc-uv-016 (250–260 m³/h) · shop excl. VAT 80 000 SEK → suggested 40 000 SEK. Editable; leave at suggestion to keep auto when log/factor changes.
SEK
Suggested from flow & head: SEK = 10 000 + 70 × Q + 3 000 × H (Q in m³/h, H in m; rounded to 1 000 SEK) → 65 000 SEK.
Current: Q = 684.9 m³/h, H = 2.50 m (≈ 7.18 kW). Editable; leave at suggestion to keep auto.
SEK/tank
Suggested from tank volume (quote-based cost basis): €/m³ ≈ C / Vα with C = 1 500, α = 0.70, then × 11.5 SEK/€; price/tank = (€/m³)×V (rounded to 1 000 SEK).
Current: V = 126.7 m³/tank → ≈ 51 €/m³ (≈ 582 SEK/m³) → suggested 74 000 SEK/tank × 4 = 296 000 SEK total (using field value).
Tank shell only (excl. VAT, freight, install, bases, roofs, fittings). Editable; leave at suggestion to keep auto.
SEK/tank
Suggested from footprint (concrete block + gravel fill): SEK = A × (250 + 250) SEK/m² where A = tank surface × 1.20 (rounded to 1 000 SEK) → 51 000 SEK/tank.
Current: surface ≈ 84.5 m² (∅ ≈ 10.37 m) → pad A ≈ 101.4 m² × 500 SEK/m² · total (field) 204 000 SEK.
Concept civil only. Editable; leave at suggestion to keep auto.
SEK/tank
Default: 100,000 SEK/tank
SEK

Effluent biofilter

Biological polishing on effluent only (Qeff ≈ 342.5 m³/h). Selector sets which package CAPEX enters the project total; nutrient model unchanged.

High-performance DynaSand Active
Suggested: 2 902 000 SEK
4× DS5000 1.5 · 87 m³/h/u · 2 shared sets · ≈725 573 SEK/filter
NW C3J8Q6 (2022) DS5000 package — ceil(n/3)×shared + n×filter. Permit-friendly continuous sand filter class.
Cost-efficient tank biofilter
Suggested: 501 000 SEK · V ≈ 256.8 m³ · pad 154 m²
h
m
SEK/m³
SEK
shell 91 000 + base 77 000 + media 308 000 + aer. 25 000 · fish-tank shell/base basis (≈31 €/m³).
SEK
Project total uses this field. Switching type updates highlight and CAPEX suggestion live; recalculate for full investment KPIs. (HP 2 902 000 · tank 501 000).
SEK total
units
SEK/u
Concept: atmospheric cascade / packed-column degasser on recirc return (matches degasser elevation in hydraulics). Also the air-side O2 path — maximises baseline oxygen uptake before pure O2 is added. Quoted prices (similar project 2026): default 1×/tank @ 42 500 SEK → suggestion 170 000 SEK (4×42 500). Set total to override; units=0 uses tank count on next fresh load. Excl. civil, blowers if forced-air, piping, VAT.
SEK
SEK
Same target log / sizing as inlet. Shop excl. VAT × quote factor 0.50 (quoted prices, similar project 2026): dbc-uv-016 (250–260 m³/h) · shop excl. VAT 80 000 SEK → suggested 40 000 SEK. Editable; leave at suggestion to keep auto when log/factor changes.
log10
Default 299.0 % reduction (aquaculture screen/barrier). Shop homepage units are drinking-water sterilisation (much higher dose) — we do not need that here.
log10
Catalog design log for dbc-uv-* (default 4). Sizing flow = Q × (target / ref). Lower target → smaller duty → lower CAPEX.
× shop
Default 0.50 — CAPEX = sized shop excl. VAT × factor from quoted prices (similar project) 2026. Suggested UV CAPEX updates with log / factor; SEK fields stay editable after calculate.

Piping (PE100-RC SDR17)

Material CAPEX from Dahl EXW unit prices (PE100-RC SDR17 pipe, wafer butterfly valves, EPDM gaskets). OD sized for design velocity; lengths are editable layout assumptions. Fittings (bends/tees/reducers) as % of pipe material. Concept factor default 0.80 (−20 % vs list; aligned with quoted prices (similar project) 2026 on material+fittings+valves+gaskets). Excl. welding labour, trench/civil, supports, freight, VAT, small-bore air/O₂.

m/s
m
Supply + return share per tank
m
Recirc / collector along row
m
m
% of pipe
pcs
pcs
×
Default 0.80 — quoted prices (similar project) 2026
SEK
OD branch d315 · header d400 ×3 · in d400 · out d400 · Σ 324 m pipe · factor 0.80 → suggested 637 000 SEK. Editable; leave at suggestion to keep auto when layout changes.

Installation work

Site labour / contractors (excl. VAT). Default: 2 weeks (80 h) per discipline @ 600 SEK/h; automation 40 h @ 800 SEK/h → ≈ 0.22 MSEK. Included in total project CAPEX and investment cash flow.

Civil
h
SEK/h
→ 48 000 SEK
Equipment
h
SEK/h
→ 48 000 SEK
Piping
h
SEK/h
→ 48 000 SEK
Electrical
h
SEK/h
→ 48 000 SEK
Automation
h
SEK/h
→ 32 000 SEK
Installation subtotal: 224 000 SEK

Project execution (PM + Engineering)

Billable hours over the execution / build period (excl. VAT). Default: 9 months · 0.5 eng FTE @ 800 SEK/h + 0.3 PM FTE @ 1250 SEK/h · 160 h/FTE-month → ≈ 1.12 MSEK. Included in total project CAPEX and investment cash flow.

months
h
SEK
Suggested: Eng 576 000 + PM 540 000 = 1 116 000 SEK. Editable total used in project CAPEX. Clear override by matching the suggestion (or hard-refresh).
SEK/h
SEK/h
OPEX Assumptions
SEK/kg
Default: 18 SEK/kg
SEK/kWh
Default: 1.20 SEK/kWh
SEK/kg fish
Default: 0.50 SEK/kg fish produced
SEK/kg O₂
% CAPEX/year
% CAPEX/year
SEK/year
SEK/year
Winter checks, covers, snow load, weather exposure etc.
Sales & stocking prices

Rainbow trout concept prices: wholesale biomass for harvest sales, and unit price per fingerling stocked (start weight from production inputs). Fingerling cost is included in annual OPEX. Defaults are indicative — replace with offtake contracts and hatchery quotes.

SEK/kg
Default 80 SEK/kg whole-fish biomass (not fillet/retail) ≈ Swedish trout export unit value (~US$ 7.17/kg · UN Comtrade basis, ~2025).
References: Sweden trout price (Selina Wamucii / Comtrade) · Norway trout (export benchmark) · FAO fish price collection · Jordbruksverket market prices (general SE food prices; limited trout series).
SEK/pcs
Default 5 SEK/pcs at start weight (concept). Real hatchery quotes vary with size, season and species/strain; stocking lists are often SEK/kg or SEK/piece by age class.
References: Hushållningssällskapet sättfisk / price lists · Jordbruksverket – fisk & vattenbruk (sector context; use local hatchery quote for CAPEX/OPEX).
%
Downgrade / unsold vs model target (100% = full harvest sold)

Investment analysis assumptions

Project starts 1 January FY0. CAPEX is spent over the build period, then first stocking waits for the chosen calendar month (default April — Nordic spring praxis). Tanks start empty; first revenue only after one full growth cycle. Optional multi-cohort staggers stockings for smoother cash flow. Fiscal years = Jan–Dec.

months
Default 9 months — equipment spend from 1 Jan FY0
First occurrence of this month at or after build end. Default April (spring — SE/NO/FI outdoor praxis).
groups
1 = all tanks stocked together. 2–4 = staggered batches (smoother harvest/revenue).
fiscal years
From 1 Jan FY0 (includes build year)
%/year
Default 8% — replace with client cost of capital
Reset defaults
Results Outputs
Production & Growth
Production Target 30 000 kg/year
Production per Tank 7 500 kg/year
Start Weight 20 g
Harvest Weight 1 500 g
Growth Period 365 days
Growth Multiplier 75.0 ×
Required Daily Growth 1.19 %/day
Fish loss (cycle) 5.0 %
Survival 95.0 %
Fish harvested 20 270 fish/year
Fingerlings stocked 21 337 fish/year
Fish lost 1 067 fish/year

Required daily growth is back-calculated from start/harvest weight and growth days (constant %/day). References: FAO O. mykiss fact sheet · FAO small-scale trout (PDF) · The Fish Site.

Biomass & Feeding
Standing Biomass per Tank 7 601 kg
Total Standing Biomass 30 405 kg
Starting Biomass per Tank 107 kg
Total Starting Biomass 427 kg
Annual Feed Requirement 31 500 kg/year
Average Feed Rate 86.3 kg/day
Feed Conversion Ratio 1.05
Water Balance
Oxygen strategy Air only (degasser)
Total O₂ transfer capacity 2.0 mg/L
· air / degasser 2.0 mg/L
· pure O₂ addition 0.0 mg/L
Water reuse 67 %
Total tank flow 1 027.4 m³/h
Fresh water flow 342.5 m³/h
Recirculated water flow 684.9 m³/h
Fresh water demand 8 219 m³/day
Estimated effluent flow 8 219 m³/day
O₂ demand (total) 49.3 kg/day · 18 000 kg/year
O₂ from air / degasser 18 000 kg/year
O₂ gas purchased 0 kg/year
Hydraulic System
Tank Water Depth 1 500 mm
Source Water Elevation 1 000 mm
Degasser Elevation 1 000 mm
Tank Volume 126.7 m³
Total Tank Volume 506.8 m³
Tank Turnover Rate 2.03 /hour
Total Static Lift 3.50 m
Flow per Tank 256.8 m³/h
Total Nozzles 9
Nozzle Diameter 92 mm
Nozzle Angle 45 °
Tank Surface Area 84.5 m²
Tank Diameter 10.37 m
Tangential Velocity 0.00 m/s
Fish Design Swim Speed 0.22 m/s
Water Treatment
Primary Solids Removal 98.0 %
Primary Solids Captured 6 115.04 kg/year
Primary Solids Remaining 124.80 kg/year
Biological Conversion 80.0 %
Organics Converted 299.40 kg/year
Biomass Produced 299.40 kg/year
Final Particle Polishing 99.95 %
Polishing Solids Removed 124.73 kg/year
Residual Solids Discharge 0.06 kg/year
Overall Solids Removal 100.0 %
DynaSand path Effluent only
DynaSand design flow 342.5 m³/h
Bio Limiting Nutrient P
Bio C Removal 11.7 %
Bio N Removal 1.4 %
Bio P Removal 80.0 %
P-binder Off
Sludge (summary)
Dry solids (total) 6 539.18 kg/year
Assumed TS 25.0 %
Wet sludge 26 156.70 kg/year
Wet sludge (avg) 71.7 kg/day
N in sludge 172.47 kg/y (2.6 % of DS)
P in sludge 137.86 kg/y (2.1 % of DS)
Overall solids removal 100.0 %
See full sludge nutrient breakdown for land application below.
Energy (indicative)
Incoming pump lift 2.50 m
Recirc pump lift 2.50 m
Incoming pump power 3.59 kW
Recirc pump power 7.18 kW
Total pump power 10.77 kW
Energy (avg day) 258 kWh/day
Energy (year) 94 327 kWh/year
Assumed pump η 65 %
Hydraulic power from static lift and design flows only. Pipe losses, aeration blowers and UV not included.
Effluents Environmental mass balance — waste from fish vs leaving system after treatment
Feed load (from annual feed)
Tot-N 2 016.00 kg/y · Tot-P 299.25 kg/y · COD 12 600.00 kg/y
Retained in fish biomass
N 756.00 kg/y (37.5 %) · P 160.64 kg/y (53.7 %) · COD 3 811.50 kg/y (30.3 %)
Effluent flow (DynaSand hydraulic load)
8 219 m³/day (342.5 m³/h) — oxy DynaSand on discharge only, not full recirc
1. Direct waste from fish

Excreted load after retention in biomass. Split into particulate solids and dissolved fractions (editable under Feed & Nutrients).

Tot-N Tot-P COD
Total waste 1 260.00 kg/y 138.61 kg/y 8 788.50 kg/y
… particulate 157.50 kg/y 134.87 kg/y 6 239.84 kg/y
… dissolved 1 102.50 kg/y 3.74 kg/y 2 548.67 kg/y
Implied conc. if untreated* 0.42 mg/L 46 µg/L 2.9 mg/L
Waste per kg feed 40.0 g/kg 4.40 g/kg 279 g/kg
*Concentration if the full fish waste load were discharged in the effluent flow with no treatment (illustrative upper bound for discussion).
2. Leaving system after treatment

After primary solids removal + oxy DynaSand on effluent (C:N:P-limited bio, limiting nutrient: P; bio C/N/P removal 12 / 1 / 80 %) . Use these loads and concentrations for environmental impact / authority discussion.

Tot-N Tot-P COD
Discharge load 1 087.53 kg/y 0.75 kg/y 2 249.32 kg/y
… particulate 0.00 kg/y 0.00 kg/y 0.06 kg/y
… dissolved 1 087.53 kg/y 0.75 kg/y 2 249.26 kg/y
Discharge concentration 0.36 mg/L 0 µg/L 0.7 mg/L
… dissolved conc. 0.36 mg/L 0 µg/L 0.7 mg/L
… particulate conc. 0.00 mg/L 0 µg/L 0.0 mg/L
Removed from water path 172.47 kg/y (13.7 %) 137.86 kg/y (99.5 %) 6 539.18 kg/y (74.4 %)
Daily discharge 2.98 kg/d 0.00 kg/d 6.16 kg/d

3. Discharge limit comparison

Model result vs targets set under Discharge limit targets. Margin = limit − model (positive = headroom). Overall: all applied criteria within limit

Criterion Model Limit Margin Utilisation Status
Tot-N concentration 0.36 mg/L 10.00 mg/L +9.64 mg/L 4 % of limit within limit
Tot-P concentration 0 µg/L 500 µg/L +500 µg/L 0 % of limit within limit
COD concentration 0.7 mg/L 70.0 mg/L +69.3 mg/L 1 % of limit within limit
Tot-N annual load 1 087.53 kg/y n/a
Tot-P annual load 0.75 kg/y n/a
COD annual load 2 249.32 kg/y n/a
Mass balance: feed nutrient → retained in fish + waste from fish; waste → primary solids sludge + DynaSand biomass/sludge + leaving system. Concentrations use effluent flow ≈ fresh-water inflow. Always verify against local discharge limits and permit conditions — defaults are not a legal permit.
Sludge nutrients (land application) Nutrient recovery to sludge streams — for soil / fertilizer discussion
Total dry solids
6 539.18 kg DS/year (26.2 t wet @ 25.0% TS)
Tot-N in sludge
172.47 kg N/year · 2.6% of DS
Tot-P in sludge
137.86 kg P/year · 2.1% of DS
Per tonne wet sludge
6.6 kg N/t · 5.27 kg P/t
Stream N (kg/y) P (kg/y) COD / DS proxy (kg/y) Notes
Primary solids 154.35 132.17 6 115.04 Drum filter / settler capture
DynaSand bio biomass 14.97 2.99 299.40 C:N:P-limited uptake (limiting: P)
Particle polishing 3.15 2.70 124.73 Fine residual solids on effluent path
Chemical P-binder 0.00 0.00 Off
Total to sludge 172.47 137.86 6 539.18
N of dry solids 2.64 % · 26 kg N/t DS
P of dry solids 2.11 % · 21 kg P/t DS
COD share of DS proxy 100.0 %
Organic dry solids use COD capture as mass proxy (primary + bio + polish); chemical sludge DS ≈ 50% of binder dose. Site lab analysis of cake (TS, Tot-N, Tot-P, metals) is required before land application. Swedish/EU sludge rules, P-ceiling and soil testing apply.
CAPEX (indicative project total)
Incoming water pump 24 000 SEK
Incoming UV (log 2.0 ≈ 99.0 %) 40 000 SEK (dbc-uv-016, Qsize 171.2 m³/h)
Recirculation pumps 65 000 SEK
Tanks + bases + roofs 900 000 SEK
Piping (PE + valves + fittings) 637 000 SEK
Particle filter 150 000 SEK
High-performance DynaSand 2 902 000 SEK (4× DS5000 1.5, 2 sets, C3J8Q6)
CO₂ degassers 170 000 SEK (4× @ 42 500 SEK)
Outlet O3 barrier 100 000 SEK
Outlet UV barrier (log 2.0 ≈ 99.0 %) 40 000 SEK (dbc-uv-016, Qsize 171.2 m³/h)
Total components CAPEX 5 028 000 SEK
Installation – Civil (80 h @ 600 SEK/h) 48 000 SEK
Installation – Equipment (80 h @ 600 SEK/h) 48 000 SEK
Installation – Piping (80 h @ 600 SEK/h) 48 000 SEK
Installation – Electrical (80 h @ 600 SEK/h) 48 000 SEK
Installation – Automation (40 h @ 800 SEK/h) 32 000 SEK
Installation subtotal 224 000 SEK
Engineering (0.5 FTE × 160 h/mo × 9 mo @ 800 SEK/h) 576 000 SEK
Project management (0.3 FTE × 160 h/mo × 9 mo @ 1 250 SEK/h) 540 000 SEK
Project execution subtotal 1 116 000 SEK
Total project CAPEX 6 368 000 SEK
Project CAPEX per kg fish 212.3 SEK/kg·year
Components only per kg fish 167.6 SEK/kg·year
Piping breakdown (material, indicative)
Branch pipe d315 · route 80 m · installed 80 m @ 1 033.69 SEK/m · v ≈ 1.18 m/s → 82 695 SEK
Header / collector 3× d400 · route 48 m · installed 144 m @ 1 661.33 SEK/m · v ≈ 0.97 m/s → 239 232 SEK
Incoming main d400 · route 50 m · installed 50 m @ 1 661.33 SEK/m · v ≈ 0.97 m/s → 83 067 SEK
Effluent main d400 · route 50 m · installed 50 m @ 1 661.33 SEK/m · v ≈ 0.97 m/s → 83 067 SEK
Straight pipe material 488 060 SEK
Fittings (35%) 170 821 SEK
Butterfly valves 8× DN300 + 4× DN300 → 122 866 SEK
EPDM gaskets (2/valve) 14 293 SEK
Piping total (rounded) 637 000 SEK (×0.80 concept factor · before factor 796 040 SEK )
Equipment/civil line items only — no land, buildings, installation labour, contingency or VAT (except shop UV list prices shown as incl. VAT for reference). UV is an aquaculture biobarrier (default log 2 ≈ 99 %), not drinking-water sterilisation. Shop catalog (dbc-uv-011…016) is DW-grade; sizing flow = Q × (target log / ref log 4), then excl. VAT × quote factor (default 0.50). UV, degassers and piping cost basis: quoted prices (similar project) 2026 (editable). Biofilter CAPEX: high-performance DynaSand (NW C3J8Q6) or cost-efficient tank biofilter (fish-tank shell/base cost basis + media), sized on effluent flow. Pipe prices: PE100-RC SDR17 EXW (Dahl MTO basis); factory lengths 5–7 m. High flow uses parallel mains (n×d400) so design velocity is kept.
OPEX (annual, indicative)
Feed 567 000 SEK/year
Fingerlings 106 686 SEK/year (21 337 pcs × 5.0 SEK)
Oxygen gas 0 SEK/year
Electricity (pumps) 113 192 SEK/year
Medication / health 15 000 SEK/year
Maintenance 150 840 SEK/year
Insurance 50 280 SEK/year
Sludge handling 25 000 SEK/year
Other outdoor OPEX 25 000 SEK/year
Total OPEX 1 052 998 SEK/year
OPEX per kg fish 35.1 SEK/kg
Labour, sales logistics and financing not included unless added under “Other. Fingerlings: stocked count = harvest fish ÷ (1 − cycle loss %).
Sales & revenue projection (indicative)
Modelled production 30 000 kg/year
Sellable biomass 30 000 kg/year (100 %)
Wholesale price (biomass) 80.0 SEK/kg
Fingerling price 5.0 SEK/pcs
Fingerlings stocked 21 337 pcs/year → 106 686 SEK (3.6 SEK/kg fish)
Annual revenue 2 400 000 SEK/year
30 000 kg × 80.0 SEK/kg
Revenue per kg sold 80.0 SEK/kg
Total OPEX (modelled) 1 052 998 SEK/year
Margin after feed only 1 833 000 SEK/year (61.1 SEK/kg sold)
Margin after feed + fingerlings 1 726 314 SEK/year (57.5 SEK/kg sold)
Gross margin (rev − OPEX) 1 347 002 SEK/year (56.1 %)
Gross margin per kg sold 44.9 SEK/kg
Components CAPEX 5 028 000 SEK
Installation 224 000 SEK
Project execution 1 116 000 SEK
Total project CAPEX 6 368 000 SEK
Simple payback (project CAPEX / margin) 4.7 years

Investment analysis

Timeline from 1 Jan FY0: 9 month CAPEX build → idle 6 mo until stocking season → first stock April (project mo 15, FY1) · 1 cohort → first harvest after growth cycle (365 d ≈ 12 mo) in FY2. Fiscal-year totals (Jan–Dec), not a flat annual margin.

Total project CAPEX
6 368 000 SEK
comp. 5 028 000 + install. 224 000 + execution 1 116 000
Steady-state margin
1 347 002 SEK/y
full year after ramp
Simple payback (FY CF)
7.3 y
Steady-state ROI
21.2 %
margin / project CAPEX
Build / first stock / first harvest 9 mo build · stock April (mo 15) · harvest mo 27 (FY2) · 1 cohort
Horizon / discount rate 15 fiscal years · 8.0 %/y
NPV (15 FY) 2 531 329 SEK
IRR (fiscal CF series) 13.5 %
Discounted payback 9.9 years
Profitability index (1 + NPV/CAPEX) 1.40
Undiscounted CF over horizon 10 326 607 SEK
Avg CF per fiscal year 688 440 SEK/y
Steady operating margin 56.1 %
Break-even fish price (steady) 35.1 SEK/kg
Break-even volume (steady) 13 162 kg/y
Unit economics (steady) rev 80.0 · opex 35.1 · margin 44.9 SEK/kg
Not included (highly client-specific):
  • Overheads / SG&A, management, admin, insurance beyond model %
  • Labour, salaries, benefits, contractors
  • Land, buildings, site prep, permits beyond equipment CAPEX
  • Working capital, inventory, receivables
  • Financing structure, interest, covenants, tax, depreciation policy
  • Contingency, FX, inflation, price/volume ramp-up, residual value
  • Sales logistics, marketing, quality claims, mortality above cycle loss %
Project CAPEX includes components plus installation plus project execution (editable rates). Treat KPIs as indicative RFQ / board framing — not a bankable investment case.
Cumulative cash flow (fiscal years)
Revenue vs OPEX vs margin
OPEX mix
Project CAPEX mix (incl. project execution)
Revenue = sellable biomass × wholesale biomass price (whole fish basis). Price defaults: fish 80 SEK/kg (≈ Swedish trout export unit value), fingerling 5 SEK/pcs — replace with offtake/hatchery quotes. Fingerling OPEX uses stocked count (harvest fish inflated by growth-cycle loss %). Investment charts: CAPEX build → first stock in chosen calendar month (default April) → growth cycle → harvest; optional multi-cohort stagger. Fiscal totals from 1 Jan FY0. No tax shield or residual value.
Model notes: Feed Tot-N / Tot-P / COD → fish retention → excreted waste (particulate vs dissolved); waste fractions primarily after Dalsgaard & Pedersen (2011) style rainbow trout mass balances. Oxygen: degasser/air baseline + additive pure O2 set total transfer capacity (higher total ΔDO → smaller tank flow); purchased gas is only the pure-O2 share of demand. Recirculation factor sets fresh-water share of tank flow. Treatment train: primary solids on particulate stream → oxy DynaSand® on effluent flow only (C:N:P-limited biomass uptake + particle polishing) → optional chemical P-binder → optional outlet biobarriers. Discharge limit comparison uses editable permit-style targets (defaults are placeholders). Sludge N/P supports land-application discussion; cake analysis still required. Always verify against local discharge limits and water rights.
Preliminary guidance only. Results support concept discussion and RFQ preparation. Final design needs site survey, water analysis, permits, detailed hydraulics and engineering review. Contact contact@dabce.se for project support.